

The Transformation Economy Is $3.6 Trillion. We Did the Math.
New research from Stone Mantel | By Dave Norton, PhD, Founder and Principal
The Transformation Economy is $3.6 trillion. That number does not exist in any government report, any industry database, or any analyst's slide deck. We built it ourselves.
Joe Pine and Jim Gilmore named the progression of economic value: commodities, then goods, then services, then experiences, then transformations. They introduced it in a 1998 Harvard Business Review article and built out the full case a year later in their book The Experience Economy. Transformations sit at the top of the value chain. A transformation isn't something you buy and consume. It's a change in the buyer themselves — a healthier body, a stronger marriage, a more competent employee, a more confident retiree. Pine has spent the years since watching that top rung take over, and in February 2026 he gave it a book of its own: The Transformation Economy: Guiding Customers to Achieve Their Aspirations, from Harvard Business Review Press — since named one of the best business books of 2026. Health care sells transformations. So does financial planning, higher education, and workforce staffing. Pine described the layer. Nobody had sized it in dollars.
So we did.
Where the Number Comes From
Two federal data sources, neither of which was built for this purpose. GDP Gross Output from the U.S. Bureau of Economic Analysis measures an industry's total sales, including sales to consumers and sales between businesses. The Producer Price Index from the U.S. Bureau of Labor Statistics tracks how much sellers charge for goods and services over time.
Neither source separates a service from an experience from a transformation. We used Pine's own framework to make that split — his Progression of Economic Value, laid out in The Experience Economy and sharpened now in The Transformation Economy. We went industry by industry, assigning a percentage of each industry's output to services, experiences, and transformations based on what that industry's work actually does for the person paying for it. A hospital stay is a transformation. A hotel stay is an experience. A dry cleaner is a service. The math gets more complicated when one industry sells all three, which is most of them.
The Number
In 2021, the transformation layer of the U.S. economy generated $3.589 trillion. In 2011, it generated $2.246 trillion. That's ten years, one global pandemic, and 60% growth.
Three industries carry most of that weight. Health accounts for $1.1 trillion. Finance accounts for $801.7 billion. Employment services (staffing, recruiting, career transitions) accounts for $551.7 billion. Those three industries alone are two-thirds of the entire Transformation Economy.
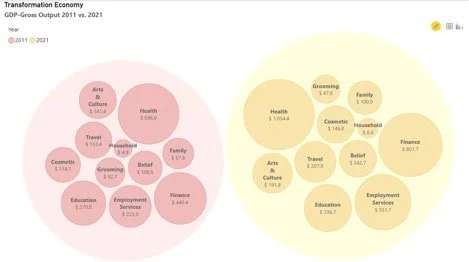
Look at what didn't show up on that list. Travel. Arts and culture. Cosmetic services. These are industries most executives associate with premium, high-margin experience design. They're real, and they're growing. They're also a fraction of the size of health, finance, and employment services.
The Transformation Economy isn't where the marketing conferences are. It's where people go when their lives are actually changing.
Twenty Years of Growth That Nobody Was Tracking
Pull back to the whole economy and the pattern holds. Services, experiences, and transformations have all grown since 1998, and transformations have grown fastest.
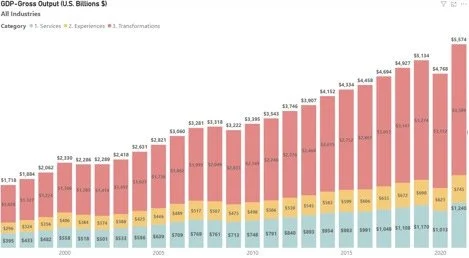
The total came to $2.06 trillion in 2000. By 2021 it hit $5.57 trillion. Two recessions interrupt that line. 2009 dips against the financial crisis. 2020 dips against the pandemic, dropping from $5.13 trillion to $4.77 trillion before rebounding to a new high the very next year.
Here's the detail that matters more than the growth. Transformations made up 63% of total output in 2011. They made up 64% in 2021. The dollar figures roughly doubled over two decades and the mix barely moved. Companies didn't shift toward selling transformations instead of services. They grew all three layers together, in roughly the same proportion, year after year. Growth in the Transformation Economy isn't a trend that's about to happen. It's been happening at a steady rate for two decades, and almost nobody built a strategy around it.
The Pandemic Didn't Hit Everyone the Same Way
Compare 2011 to 2021 industry by industry and one story falls apart immediately: the idea that the pandemic set the whole Transformation Economy back.
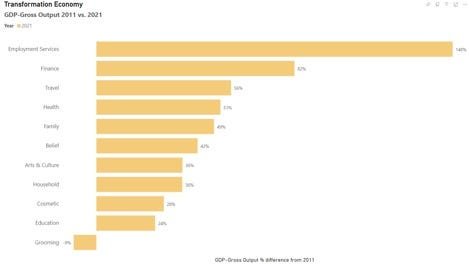
Employment services grew 148%. Finance grew 82%. Travel, despite a near-total shutdown in 2020, still grew 56% over the decade. Health grew 51%. Family, belief, arts and culture, household, and cosmetic all posted double-digit growth. Education grew 24%. Grooming is the only industry on the list that shrank, down 9%.
That spread is the tell. A pandemic that hit every industry equally would produce a cluster of numbers. This produced a spread from -9% to 148%. The businesses that grew fastest weren't the ones selling comfort or convenience. They were the ones people turned to when their circumstances forced a change: a new job, a market that needed navigating, a body that needed care. People don't cut spending on the transformations they need. They cut spending on the transformations they'd merely like to have.
Industry by Industry
Health
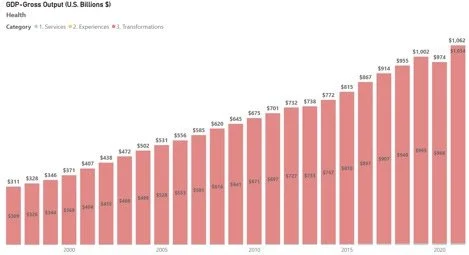
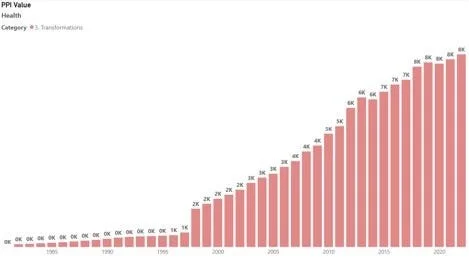
Health is the largest transformation industry and the most consistent. GDP-Gross Output climbed from $311 billion in 1998 to $1.062 trillion in 2021, with only the mildest dip during the pandemic before a fast recovery. Notice something else in the chart: health carries almost no separate services or experiences layer. Nearly the entire industry counts as transformation, because that's what buying health care is. You don't hire a hospital for the ambiance.
Pricing tells the same story from a different angle. The Producer Price Index for health has grown at a steady, compounding rate since the late 1980s, with no pandemic disruption visible at all. Health transformations got more expensive every single year, recession or not.
Finance
Finance is the clearest example of an industry that sells all three layers at once, and sells more of each every year. Total output reached $1.735 trillion in 2021, split across a services layer (basic transactions), an experiences layer (advisory relationships), and a transformations layer (wealth building, retirement security) that alone accounts for $802 billion.
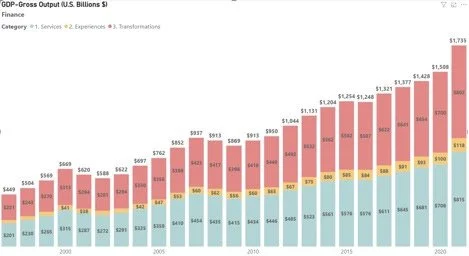
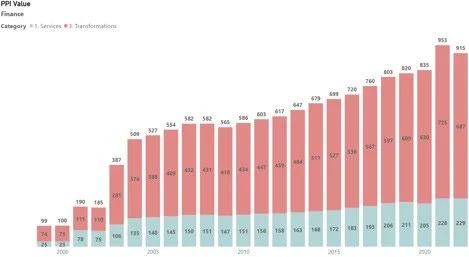
Finance grew through the pandemic instead of despite it. Market volatility in 2020 drove people toward advice, not away from it. The PPI chart confirms the same acceleration in pricing power.
Travel
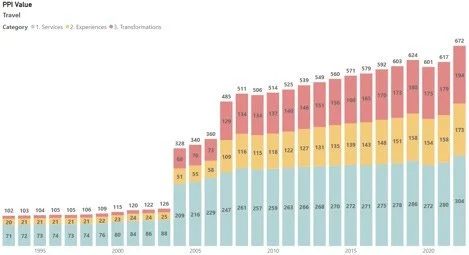
Travel took the hardest hit in this entire dataset and it isn't close. GDP-Gross Output dropped from $788 billion in 2019 to $476 billion in 2020, a collapse no other industry in this study came near. And it came back. By 2021, output reached $723 billion, most of the way back to pre-pandemic levels in a single year.
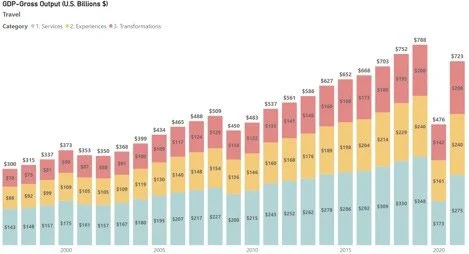
Travel is also the industry where the experiences layer is largest relative to the transformation layer. People buy plenty of travel that's about the experience itself, not a change in who they are. The transformation slice — the trips people take because they need to and not because they want to — held up even in the worst year.
Wellbeing
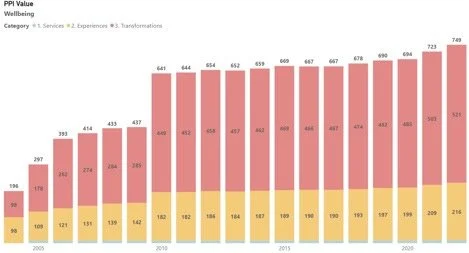
Wellbeing pricing has climbed in an almost uninterrupted line since 2005, from a PPI value of 196 to 749 in 2021. No dip in 2020. No dip in 2009. People do not treat their wellbeing as discretionary spending, and the price data proves it.
Employment Services
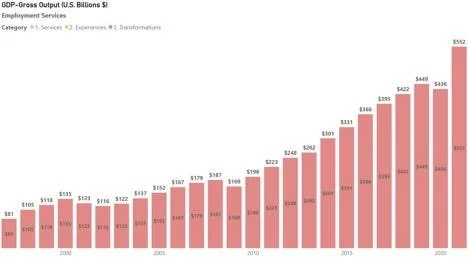
Employment services grew faster than any other industry in this study, and the timing explains why. Output barely moved in 2020 and then jumped from $436 billion to $552 billion in 2021, a 27% single-year gain. When millions of people change jobs at once, staffing and recruiting firms do the busiest year of their existence.
Education
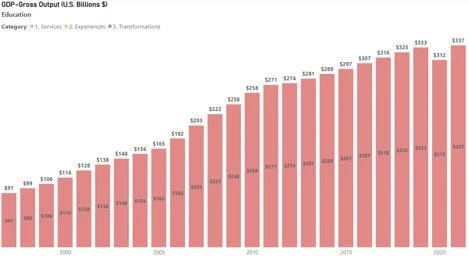
Education grew from $91 billion in 1998 to $337 billion in 2021, dipping only slightly in 2020 before resuming its climb. Education is entirely a transformation business, same as health: nobody enrolls for the experience of sitting in a classroom.
Arts & Culture
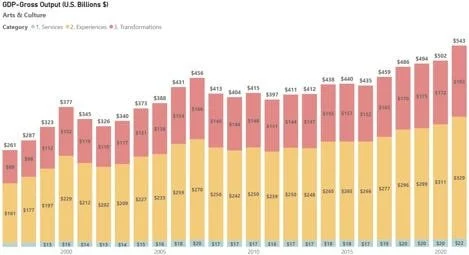
Arts and culture has grown every year for the last five years of the dataset, reaching $543 billion in 2021. Most of that output sits in the experiences layer rather than the transformation layer, which fits: a museum visit is memorable, but it isn't usually life-changing. The $192 billion transformation slice is real, though, and it's the fastest-growing part of the category.
Cosmetic
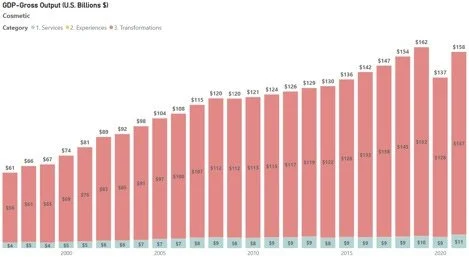
Cosmetic services grew steadily from $61 billion in 1998 to a 2020 peak of $162 billion, then pulled back to $158 billion in 2021. That makes cosmetic one of the only industries still short of its pre-pandemic high. Elective transformations are the first thing people postpone when their own circumstances get uncertain.
Belief
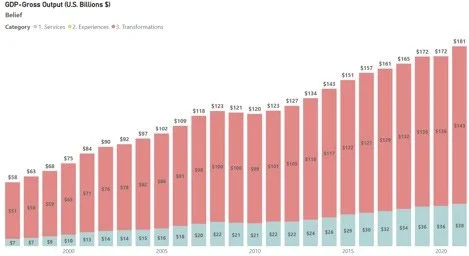
Belief (religious and spiritual organizations, and the services around them) has grown in a nearly uninterrupted climb since 1997, reaching $181 billion in 2021 with only one brief pullback along the way. That kind of consistency doesn't show up anywhere else in this study.
Family
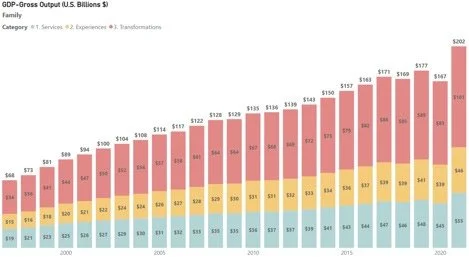
Family posted the sharpest single-year jump outside of employment services: from $167 billion in 2020 to $202 billion in 2021, a 21% gain in twelve months. Families spent two years rethinking how they wanted to live together. In 2021, they acted on it.
Grooming
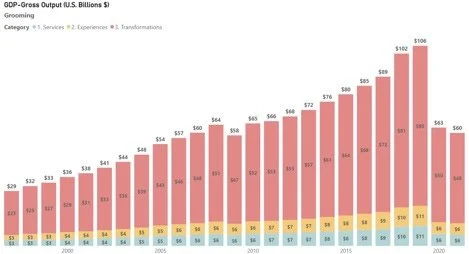
Grooming is the one industry that ends this study smaller than it started the decade. Output peaked at $106 billion in 2019, then fell to $60 billion by 2021 and never recovered. Grooming lives almost entirely in the experiences and services layers (haircuts, manicures, routine upkeep), and those are exactly the categories people stopped needing when they stopped leaving the house.
Household
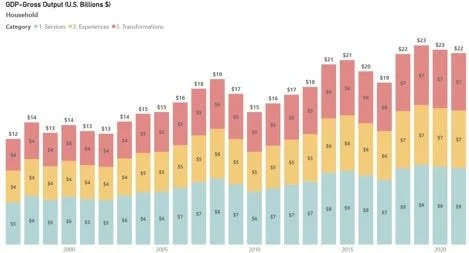
Household is the smallest industry in this study by dollar value, reaching only $22 billion in 2021. It's also the one whose trend line looks least connected to the pandemic, rising and falling in a pattern that tracks something other than the events driving every other industry here. Small markets don't always move with the news. That's worth remembering the next time a strategy meeting assumes every category responds to the same forces.
What This Means for Your Strategy
Pine and Gilmore's progression puts transformations at the top for a reason, and Pine spent the years since sharpening exactly why. In The Transformation Economy he puts it in one line: commodities and services are time well saved, experiences are time well spent, and transformations are time well invested. Services help someone get something done. Experiences give someone something worth remembering. Transformations change who someone is.
Many companies still compete on service reliability and experience quality, and they measure success in satisfaction scores. The data in this study says the money moved somewhere else. $3.6 trillion of the U.S. economy is now organized around helping people become someone different than who they were, and it grew through a pandemic that shut down entire sectors of the economy built on the two rungs below it.
The industries that grew fastest weren't the ones optimizing the experience. They were the ones people needed when their life required an actual change. Employment services didn't win because staffing firms improved their customer experience. They won because 2021 was the year millions of people needed a different job, and only a transformation could get them one.
If your company sells a service or an experience, ask what the transformation is on the other side of it. Someone is trying to become something. And the companies that name that change, design for it, and price it accordingly are the ones sitting inside a $3.6 trillion economy that most of their competitors don't even know exists.
That question — what change are your customers actually trying to make, and what new market forms around it — is exactly the kind of work we take up inside our Collaboratives, the cross-industry councils of senior leaders we've convened for fifteen years to define opportunities before they become obvious and crowded. If you'd like to explore what the Transformation Economy means for your company, book time with Dave.
Want the full report as a presentation? Contact us for a copy.
Methodology: GDP-Gross Output data from the U.S. Bureau of Economic Analysis; Producer Price Index data from the U.S. Bureau of Labor Statistics. Industry totals were allocated across services, experiences, and transformations based on Stone Mantel's assessment of each industry's primary economic function.
Dave Norton, PhD, is the founder and principal of Stone Mantel, a strategy consultancy focused on experience and transformation strategy. [Edit bio line as needed.]